



Understand how customers use your store space
Track zone activity, heatmaps, and movement patterns to understand which areas of your store attract attention, where people stay, and how they move through the space.
Zone footfall analytics for smarter store layouts
WiseVizer shows how customers interact with different areas of your store. Instead of only looking at sales results, retail teams can see where activity is concentrated, how occupancy changes across zones, and which spaces may need layout, merchandising, or staffing adjustments.
Here’s what it delivers:
- Real-time occupancy insights showing how many people are present in specific zones.
- Zone-based activity data to compare busy and underused areas.
- Dwell time analytics to understand how long customers remain in each zone.
Zone activity tracking
Every section of your store is monitored with precision, giving you a live picture of activity levels and current occupancy. You’ll know how many people are in the store, which areas attract the most visitors, and how this shifts across the day.
Movement path visibility
Visualize how customers move through different areas and identify the most used paths. Place high-margin or promotional products in the most visited zones to improve visibility and sales impact.
Layout and merchandising testing
Compare zone activity before and after changes in layout, displays, or promotions. Spot peak and quiet hours to adjust staffing, and use the reports to improve daily operations, marketing, or seasonal planning
Heatmaps and Trajectories Made Practical
Real-Time Zone Analytics
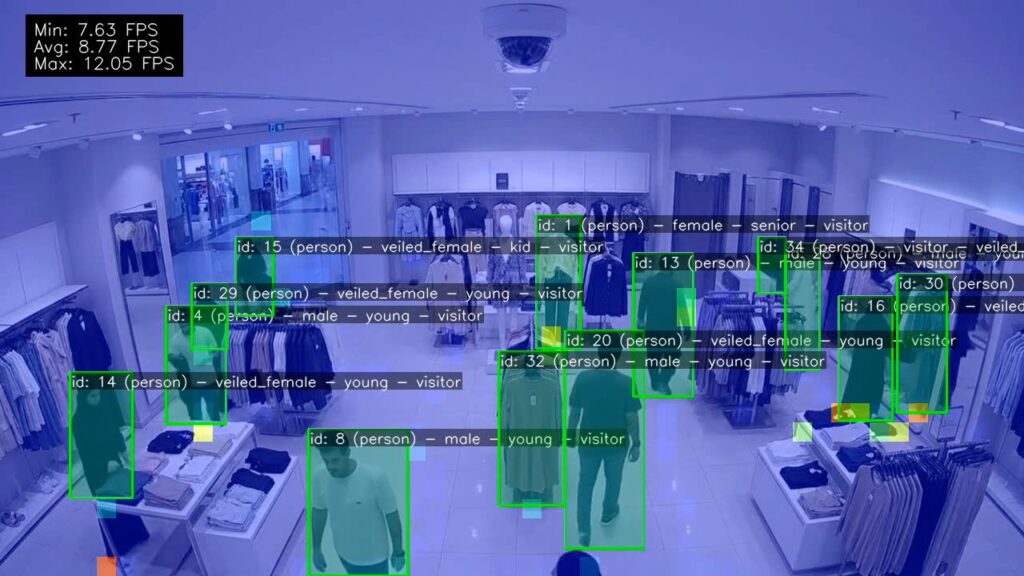
Our system builds heatmaps directly from camera feeds, updating continuously to show how people spread across the store. These visual maps highlight activity in specific areas, making it easy to spot hotspots, low-traffic zones, and changes in movement as they happen. Over time, this helps identify peak and off-peak hours, informing decisions around staffing, cleaning schedules, and daily operations.
Live and Historical Comparisons
Review traffic patterns as they happen or analyze past data to identify long-term trends. Zone comparisons can be combined with other features such as gaze detection to understand not just where customers go, but also what products they notice most.
On-Device Processing
All processing is done locally, so data remains inside your store without relying on external servers.
Zone Footfall for Smarter Store Layouts
Our system shows how people use different areas of your store. Heatmaps highlight busy zones, while trajectory tracking shows the paths customers take. This gives you a clear picture of dwell times, movement patterns, and underused spaces, while also pointing out the busiest and quietest times of day for better staffing and operational planning.
Here’s what it delivers:
- Real-time heatmaps showing where activity is concentrated.
- Trajectories that reveal the most common paths through the store.
- Dwell time analytics to measure how long people stay in each zone.
Continuous Zone Tracking
Every section of your store is monitored with precision, giving you a live picture of activity levels. You’ll know which areas attract the most visitors at any given time and how this shifts across the day.
Clear Journey Patterns
Visualize how customers move through different areas and identify the most used paths. Place high-margin or promotional products in the most visited zones to improve visibility and sales impact.
Data-Driven Layout Testing
Compare zone activity before and after changes in layout, displays, or promotions. Spot peak and quiet hours to adjust staffing, and use the reports to improve daily operations, marketing, or seasonal planning.
24/7 Accurate Foot Traffic Monitoring & Differentiation
Heatmaps and Trajectories Made Practical
Real-Time Zone Analytics
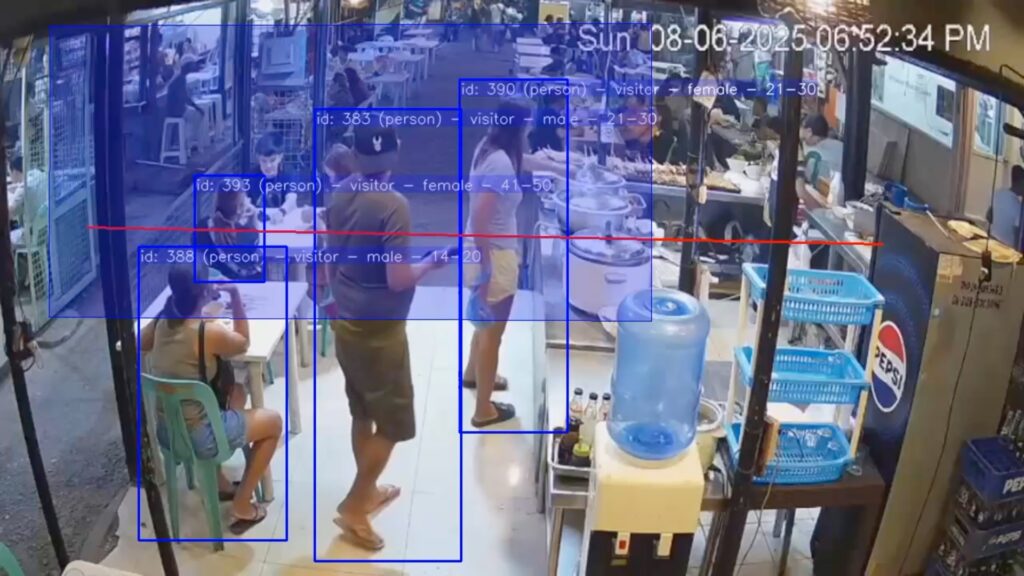
Our system builds heatmaps directly from camera feeds, updating continuously to show how people spread across the store. These visual maps highlight activity in specific areas, making it easy to spot hotspots, low-traffic zones, and changes in movement as they happen. Over time, this helps identify peak and off-peak hours, informing decisions around staffing, cleaning schedules, and daily operations
Live and Historical Comparisons
Review traffic patterns as they happen or analyze past data to identify long-term trends. Export reports for operations, marketing, or planning. Zone comparisons can be combined with other features such as gaze detection to understand not just where customers go, but also what products they notice most.
On-Device Processing
All processing is done locally, so data remains inside your store without relying on external servers.
What this helps
you improve
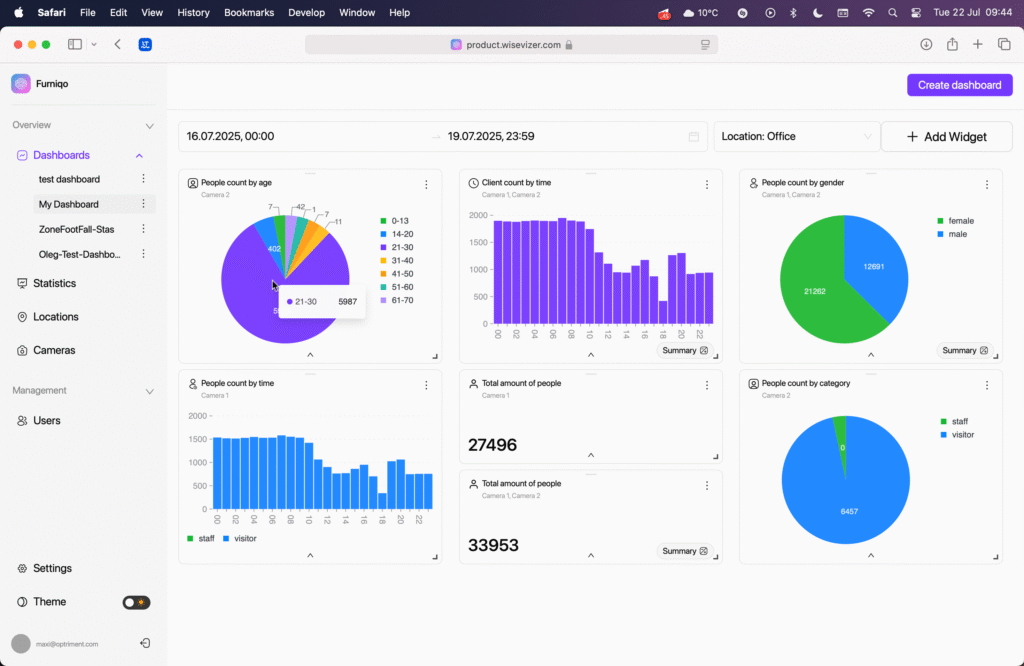
Use zone activity, heatmap, and movement data to make better decisions about store layout, merchandising, and in-store operations.
Product placement
Identify high-attention areas and place key products where customers are more likely to notice them.
Layout planning
Understand which routes customers naturally follow and adjust the store layout to support better movement.
Underused space
Spot areas with low activity and test changes in signage, displays, or product categories to increase engagement.
Use movement data to improve layouts,
displays, and store planning
Let’s Bring AI to Your Business
For inquiries, demos, or partnerships, reach out to us:
Address
Business Bay Opal Tower, Office 101-03, Dubai, UAE